Plotly is a new plotting library that supports an array of languages. It also supports python and most importantly it can be used to plot offline and integrates very well with jupyter notebooks. It thus serves as a good alternative for existing popular libraries like matplotlib and bokeh.
I have always been attracted towards pretty UI’s and plotly excels at generating them without any effort on your part and you can argue that you can generate pretty graphs using matplotlib too. I would not disagree against that point as I am currently using seaborn with matplotlib to do the same.
Now let me come to the point, I needed to generate graphs for my robot optimization task and the process would generate lots of data and I needed the data to be plotted in real-time(not real real-time). By this time I was in love with plotly and I wanted to make it work with plotly. I had a few requirements for that.
- The graphs needed to be big, as the plots in jupyter notebooks are very small.
- The graphs should be able to update itself as data gets added.
I started off to accomplish the first part and this brings me to this post on how I created a jupyter extension to create full-screen graphs for plotly. Jupyter has good documentation on how you can extend the notebook by creating custom frontend extensions. I wanted to add a button that could then be used to expand the graphs to occupy the entire real estate of my big screen.
Jupyter extension [Ploty-Fullscreen][1] can be installed and enabled using the following commands
jupyter nbextension install `$PWD`/plotly-fullscreen --symlink --user
# Enable the extension and here we use main because our javascript resides in
# plotly-fullscreen/main.js file
jupyter nbextension enable plotly-fullscreen/main --user
Jupyter frontend extension is a javascript file that defines an AMD module. The file should expose a function load_ipython_extension that will be called when the module is loaded and can be used to initialize the extension.
define([
    'base/js/namespace',
    'base/js/events',
    'require'
], function(Jupyter, events, require) {

   function load_ipython_extension() {
        // Initialization

   }
    return {
        load_ipython_extension: load_ipython_extension
    };
});
The Jupyter variable contains a lot of functionality and the events can be used to listen to events generated by the notebook in a style similar to jQuery. The button is created by listening to two events
kernel_ready.Kernel- We listen to this event because we want the graphs to have a button when we first load the notebook.plotly_afterplot- Plotly generates this event after the graph has been plotted.
Let’s plot a graph and see how this extension works.
import numpy as np

from plotly.offline import init_notebook_mode, iplot
from plotly.tools import FigureFactory as FF

init_notebook_mode()

t = np.linspace(-1, 1.2, 2000)
x = (t**3) + (0.3 * np.random.randn(2000))
y = (t**6) + (0.3 * np.random.randn(2000))


fig = FF.create_2D_density(x, y, hist_color='#1b53b9', point_size=3)

iplot(fig)
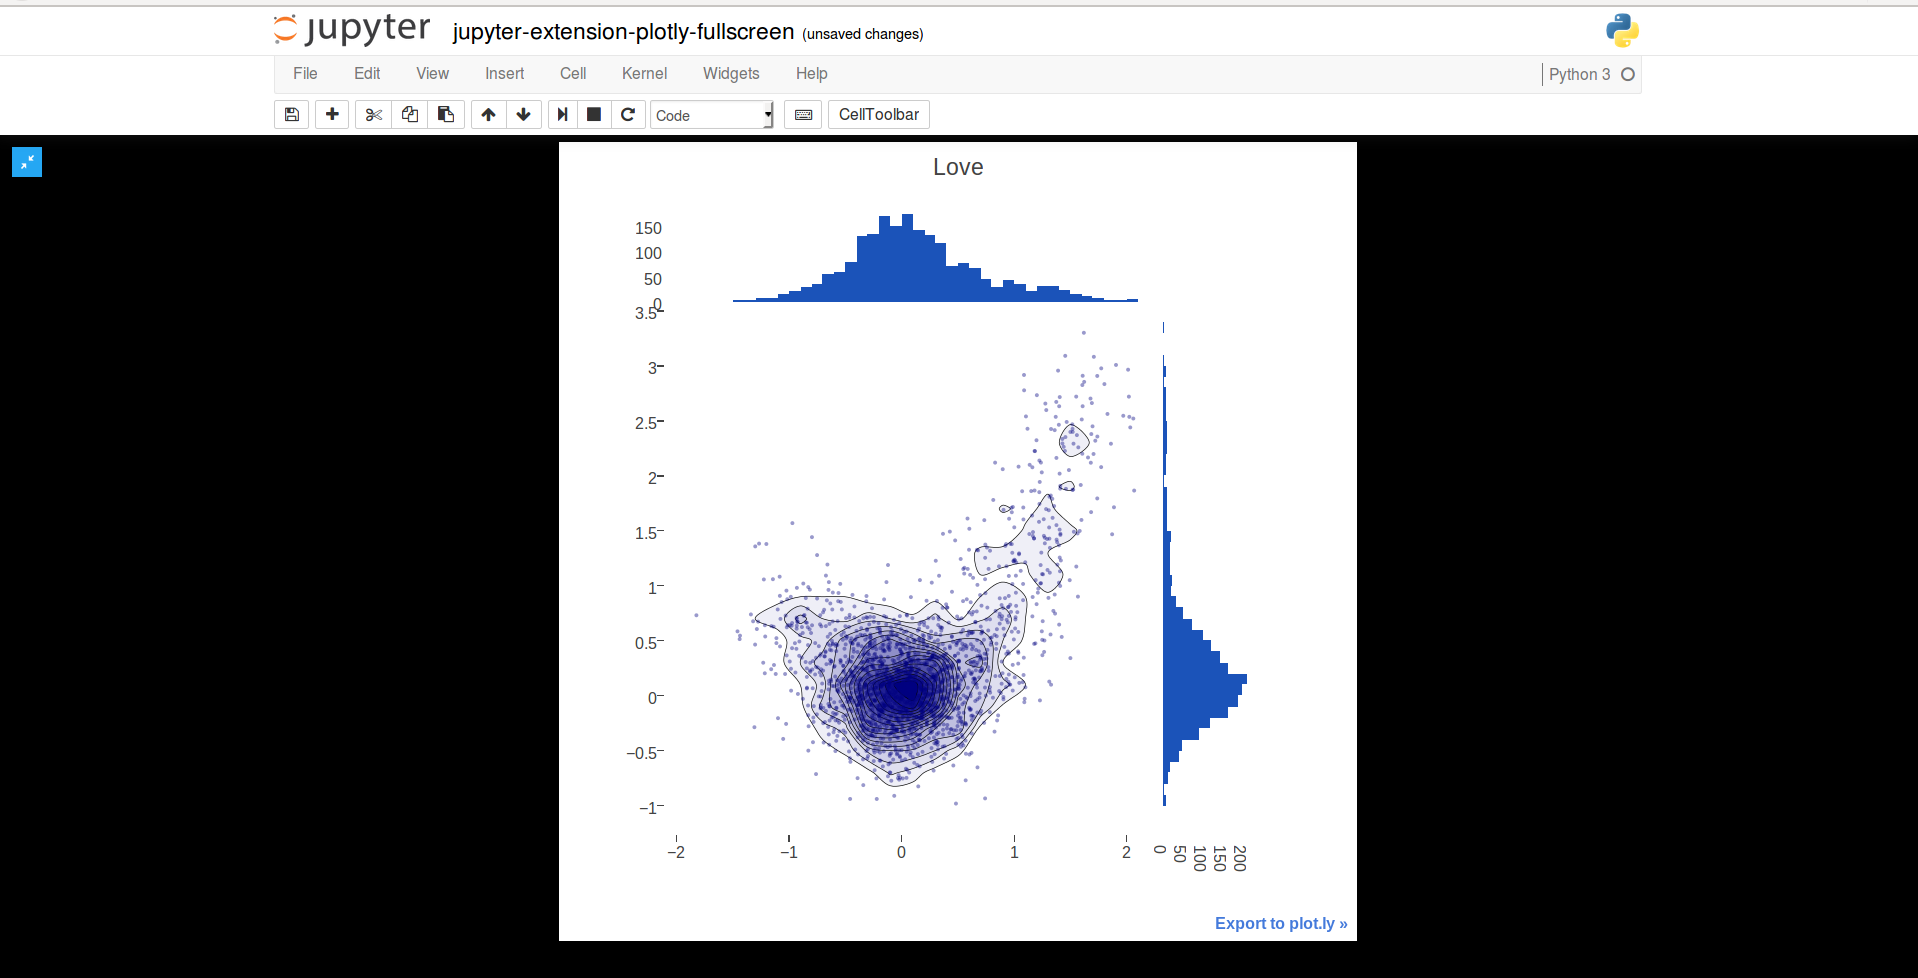
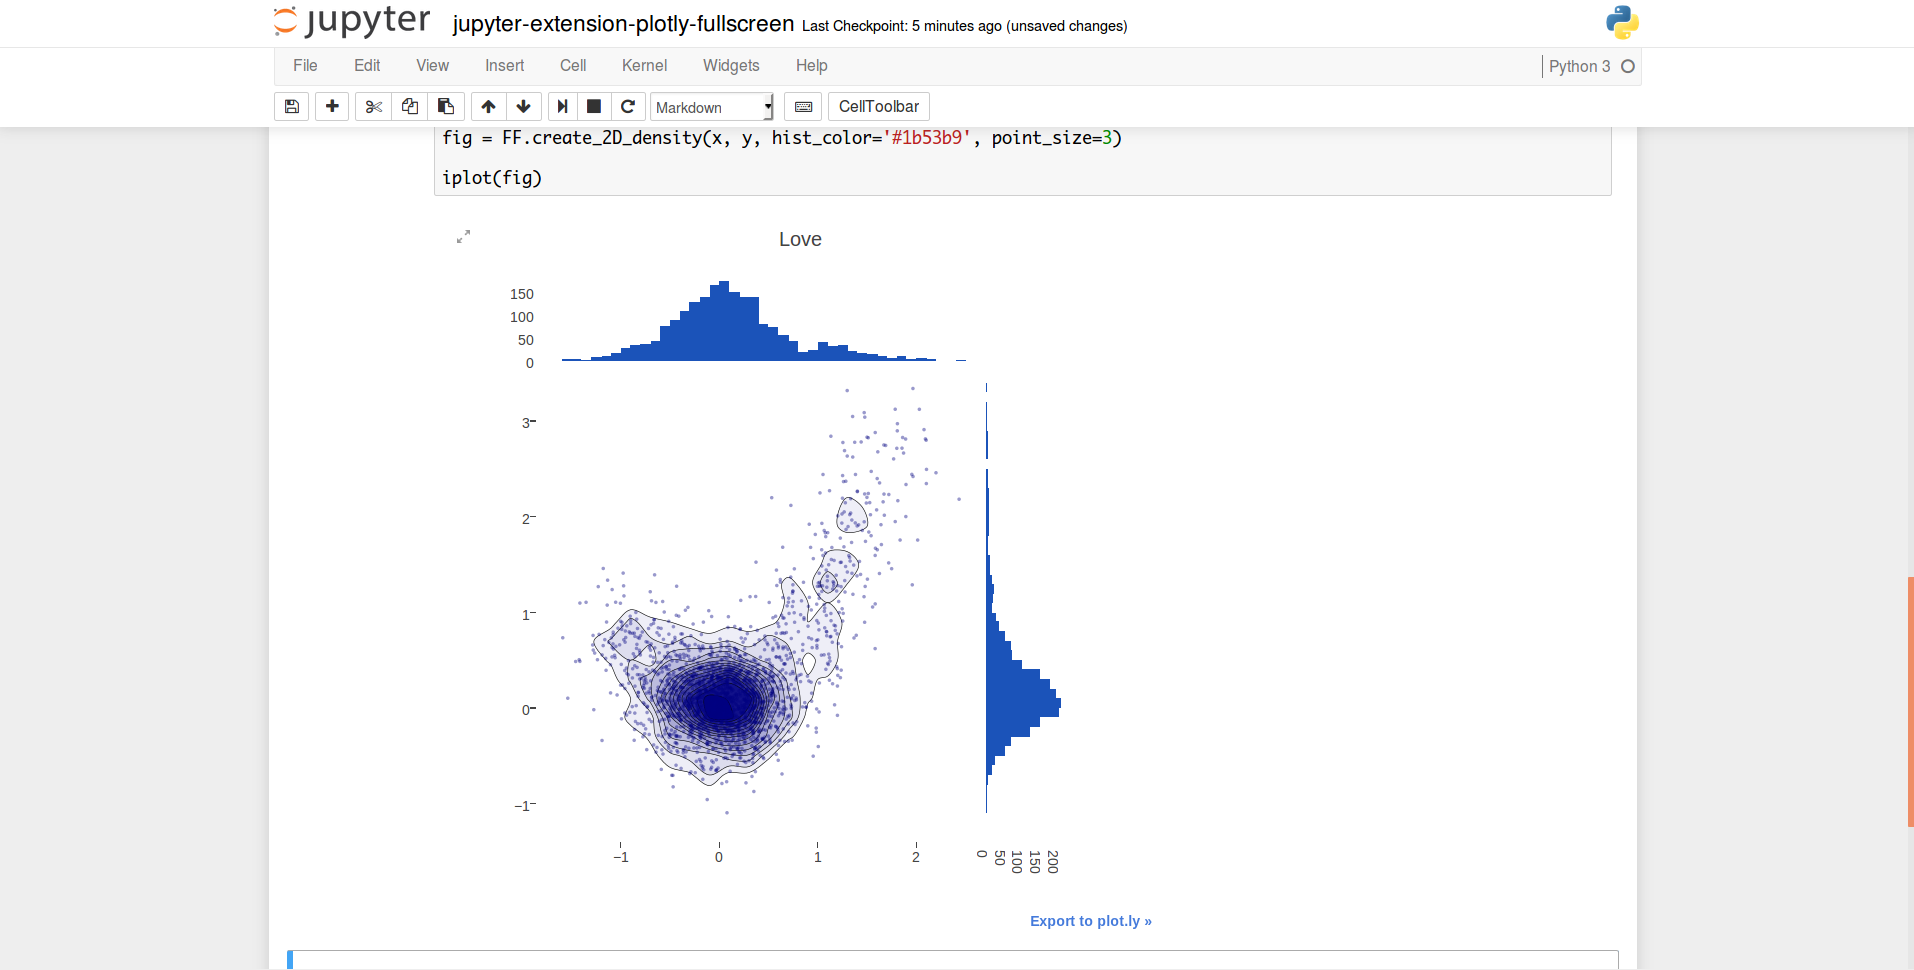 You can see the button on the top left of the graph that can be now pressed to expand the graph. The graph now scales to strech the smallest of the screen dimensions as seen in the below image, the solution is not perfect as the tooltips seem to have gone haywire.
Now that we have seen how the extension works let’s go back to my graph problem. I solved the fullscreen problem, but I was unable think of straight solution to get the graph updates working without it involving more of javascript magic as I wanted the solution to be in python. So finally I went back and used matplotlib with seaborn.